
*Quick Intro: I plan to keep this post live and updated as I add more and more scapes as I make them, so check back periodically for more!*
I am honored and humbled to say that the Scripps Institute of Oceanography in San Diego used one of these visualizations as their photo of the week! Thank you to them and thank you to Fairlie for sharing my spectrogram experimentation with her lab! Here is the link: https://scripps.ucsd.edu/news/photo-week-look-sound-sea
— — — — — — — — — — — — — — — — — — — — — —
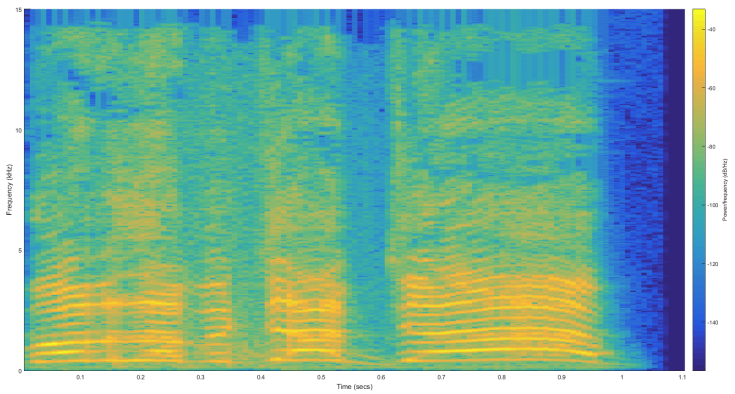
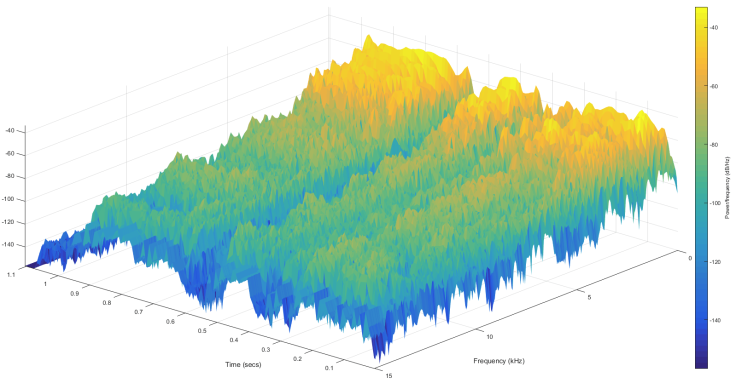
My research at Georgia Tech focuses on acoustics, and part of my work entails analysis of underwater acoustics data collected during an experiment. As part of this process I learned about spectrograms, how they work, and how they graphically show time and frequency information contained within a sound sample. I have been performing all of my analysis in MATLAB, and had to teach myself quite a bit more about plotting to get to a point where I could work the plots easily enough to show the findings of my analysis. Part of this was the discovery that I could actually rotate spectrogram plots and view them as 3D surfaces! Here’s what I mean, demonstrated using a spectrogram performed on a soundbite of Rick from Rick and Morty saying “Wubba Lubba Dub Dub!”:
2D Spectrogram Plot:
Now let’s see this bad boy in 3D:
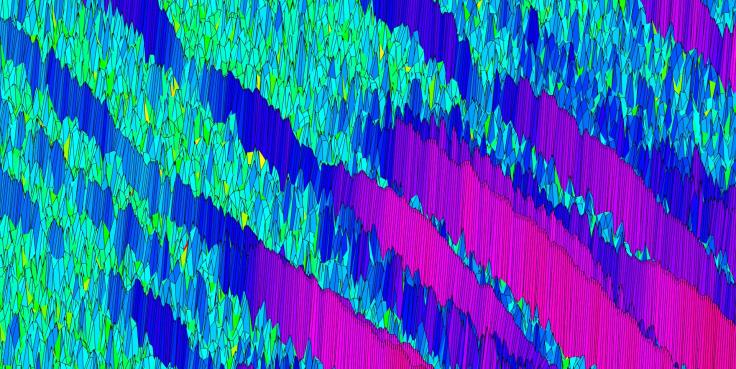
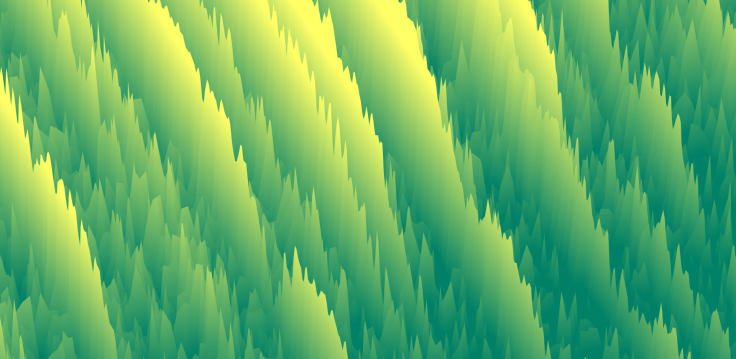
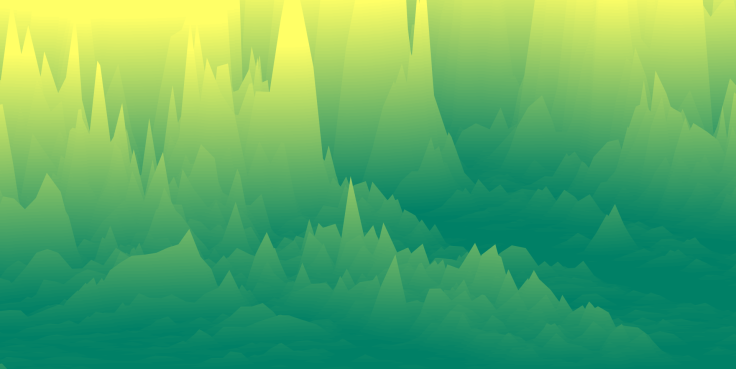
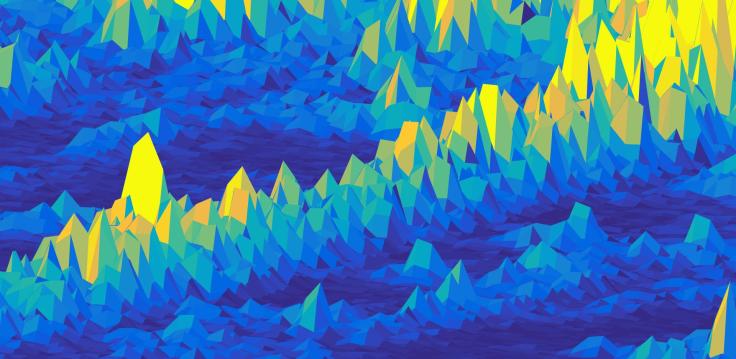
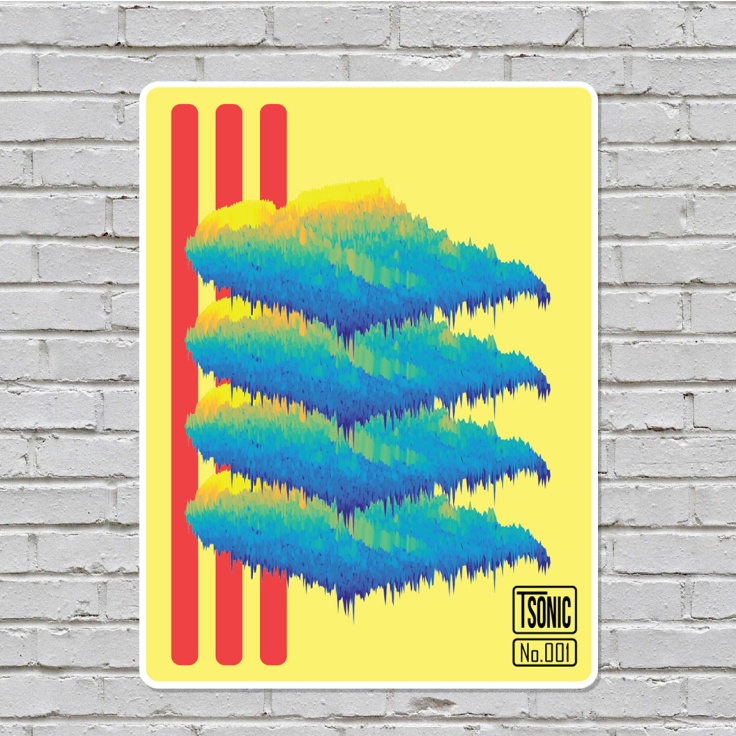
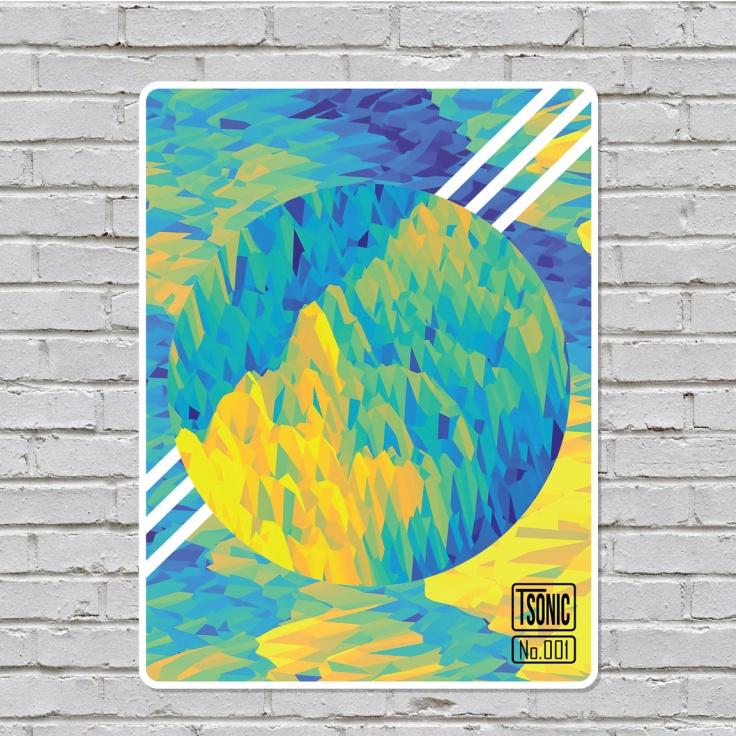
Upon showing this to my roommate and artistic partner-in-crime Charlie, we started to talk about how different sound-landscapes could be created by changing the colormap of the surface and zooming in to “explore” the physical landscape created by the spectrogram. By doing this very basically with one sound file and default colormaps, by capturing the result we were able to create some amazing patterns and layouts.
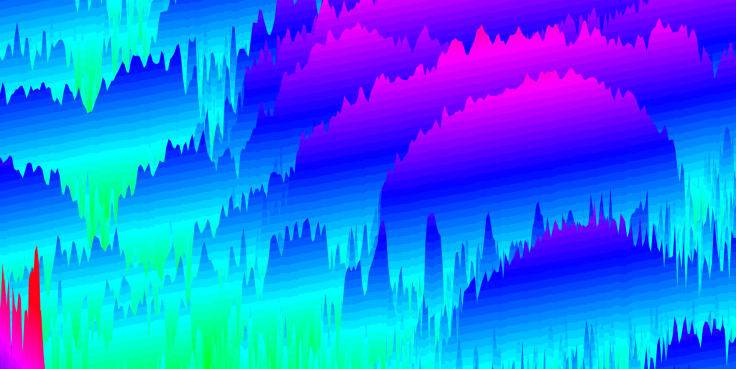
I have another good friend at UCSD who has taken samples of ocean sounds such as humpback whale calls and beluga whale clicks, and performed her own spectrograms for the acoustic work she does. Charlie and I spent some time experimenting with the spectrograms of beluga whale clicks and here is what some of those looked like:
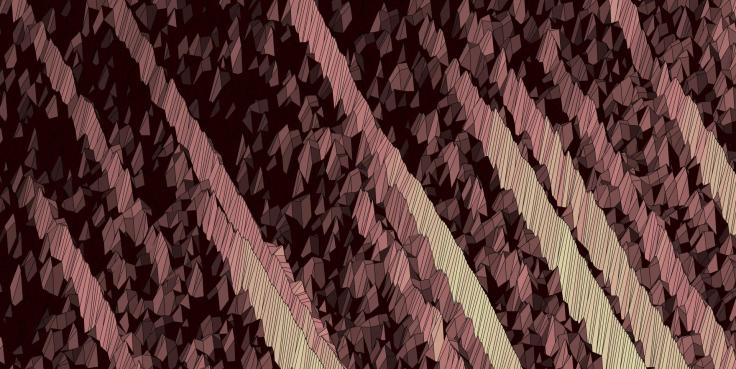
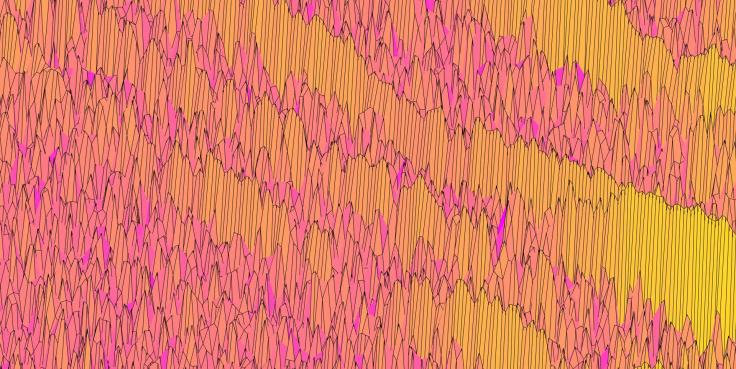
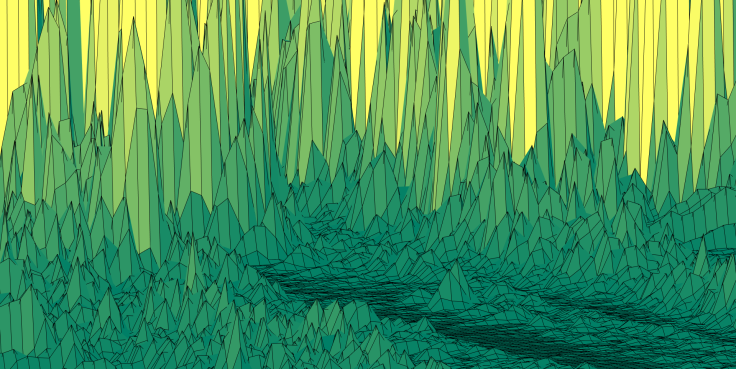
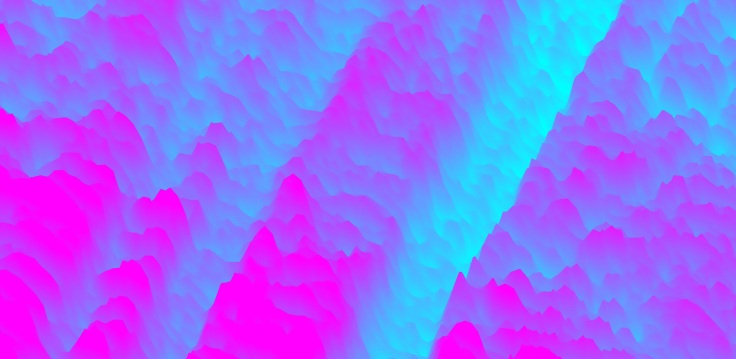
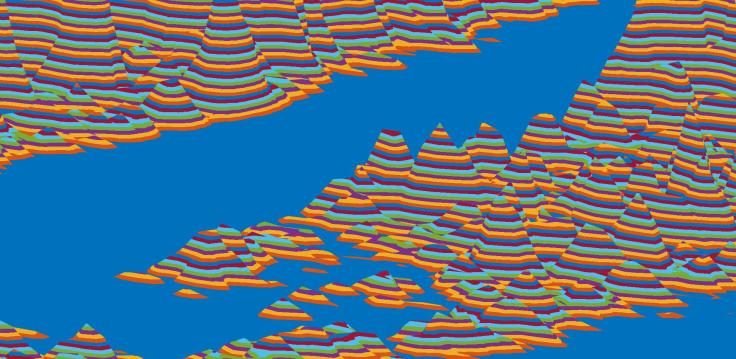
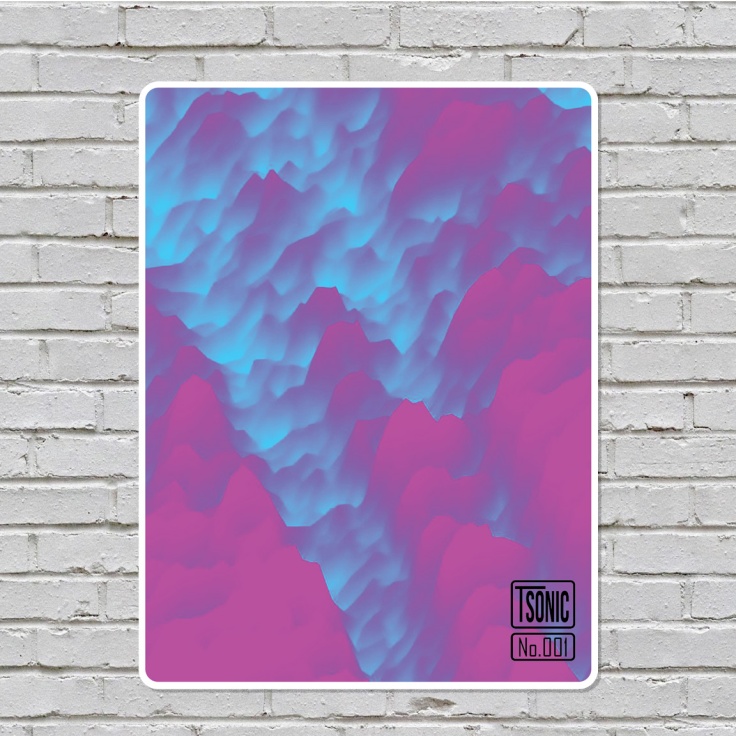
As I’ve explored more of the settings of surface plots, I’ve found more ways to alter their appearance to create softer peaks, varied types of shading, and different camera options.
As mentioned at the top of this post, I plan to keep this post updated with more pictures as I develop new scapes. Thank you for reading, and enjoy!


Leave a comment